HubSpot
Why is Customer Data Unification Important?
Learn why customer data unification is essential for personalized marketing, sales efficiency, and how to implement with Hubspot
Discover how to enhance analytics solutions with HubSpot's interactive dashboards and custom reports for data-driven decision-making.
But raw data alone isn't enough. It needs to be transformed into actionable insights. That's where HubSpot custom reports come in.
These powerful tools allow you to visualize data, track key performance indicators, and uncover trends. They empower businesses to streamline processes, improve efficiency, and drive revenue growth.
In this guide, we'll explore how to create and leverage HubSpot custom reports for data-driven decision-making. Let's unlock the full potential of your data.
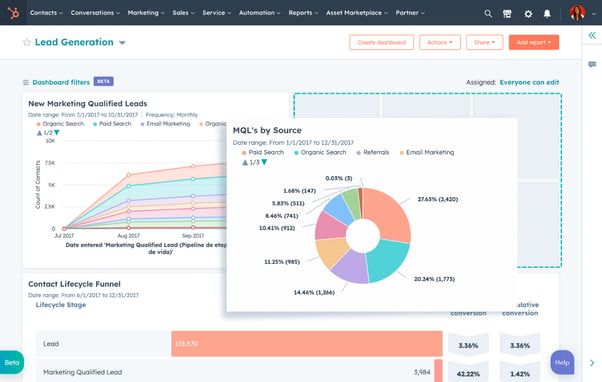
HubSpot's reporting tools are designed for customization. They allow you to tailor reports to your specific needs.
You can choose what data to include, how to visualize it, and who to share it with. This level of customization provides a clear view of your performance metrics.
Custom reports can highlight trends, identify bottlenecks, and reveal opportunities. They turn raw data into actionable insights.
In essence, HubSpot custom reports are a powerful tool for data-driven decision-making. They empower businesses to make informed, strategic decisions.
Creating impactful custom reports in HubSpot involves a few key steps. The process begins with identifying your data sources.
Next, you select the performance metrics that align with your business goals. Then, you design interactive dashboards for clarity and ease of use.
Here are the steps in more detail:

Your data sources are the foundation of your custom reports. They provide the raw data that you'll analyze.
It's crucial to identify all relevant data sources to ensure comprehensive reporting.
Performance metrics are the key indicators of your business's health. They measure your progress towards your goals.
Choosing the right metrics is essential for meaningful, actionable reports.
Interactive dashboards visualize your data. They make it easy to understand and act upon.
A well-designed dashboard can highlight key insights and drive user engagement.
HubSpot's analytics solutions offer powerful tools for growth. They provide insights that can drive strategic decision-making.
These solutions can streamline sales processes and enhance marketing campaigns. Let's explore how.
Data visualization can transform your sales processes. It can highlight trends and opportunities in your sales data.
With clear visuals, your sales team can make data-driven decisions quickly and confidently.
Personalization is key to successful marketing campaigns. HubSpot's custom reports can help you segment your customer data effectively.
With better segmentation, you can create personalized campaigns that resonate with your audience.
HubSpot custom reports can bridge the gap between departments. They can integrate data from sales, marketing, and customer service.
This integration fosters collaboration, helping teams work together towards common goals. It's a game-changer for operational efficiency.
HubSpot custom reports are more than just data visualization tools. They are catalysts for business intelligence, driving data-driven decision-making.
In the end, these reports empower businesses to unlock their full potential, fostering growth and efficiency.
Learn why customer data unification is essential for personalized marketing, sales efficiency, and how to implement with Hubspot
Struggling with poor CRM data? Discover how bad data could be costing your business millions and learn actionable strategies to fix it using HubSpot....
Learn how to dedupe HubSpot contacts, eliminate dirty data, and super-charge your CRM with a proven cleanup playbook, expert tips, and a free...